
Building a field-wide plan for technical SAI research
The goal of the SAI Research Roadmap is to illuminate how the field can progressively move scientific knowledge toward a better-constrained, higher-confidence understanding of how SAI would function and impact everything from the microphysical level to global climate effects.
The Roadmap builds on the Uncertainty Database which maps what is still unknown about SAI and rates each uncertainty on two axes: how much it matters for the deployment decision (decision relevance) and how well-constrained it currently is (degree of uncertainty). Said another way, the Uncertainty Database identifies which questions need answering before a well-informed deployment decision is possible.
The SAI Roadmap takes the next step: scoping, sequencing, and costing out the research activities that generate the evidence those open questions require. A research activity is included in the Roadmap only if it measurably reduces an uncertainty identified in the Uncertainty Database or is a necessary input/precursor to the research that would do so.
Defining the research activities
We started by identifying and scoping the individual research activities that would address the priority uncertainties in the Uncertainty Database. The list of research activities evolved continuously throughout the process and ultimately landed at 45 in total.
We began with justification and scope — what the activity involves, why it matters, and which uncertainty it addresses. For scope, some activities have two layers. First, the minimum version: what would it take to answer the key research question at all? Second, an extended version: what additional work would make that answer more robust — more sites, more models, more teams, more replication. Each research activity was scoped to produce at least one research paper or equivalent product.
Where Reflective did not have internal expertise, we identified one to four external experts in the relevant field and interviewed them to refine the scope of work, better understand how long it would realistically take, and what each component would cost. We then cross-referenced what we heard among multiple experts with additional research and publicly available information, rather than taking any single estimate at face value.
Budget estimates cover personnel time, equipment, supplies, data storage, compute, publication costs, travel relevant to the research, and a flat 20% indirect cost rate. Estimates do not account for inflation and do not include conference travel. The timeline accounts for all work from the start of a research activity to preprint submission. It does not include the full publication cycle that follows as peer review and formal publication happen on their own schedule, and the results available in the preprint are typically sufficient to unlock subsequent work. Additionally, some research activities represented in Phase 0 are already in progress.
Research activities scheduled further in the future are necessarily less certain in scope, budget, and timeline than near-term ones. The aerosol evolution and transport experiment is a clear example: its material quantity, aircraft platform, and duration all depend on decisions and research results that haven't happened yet, so its budget and timeline estimates are low-confidence. In some cases we cannot reasonably estimate a budget, as too little information exists to inform such an estimate and/or the research activity has no specific designated “end” so the cost is marked as “Not yet scoped” and the timeline is marked as “ongoing”.
For every activity, we determined what research it depends on or unlocks. That dependency map determined how the work is sequenced. From there, we grouped the activities into four research tracks (described below), and organized the work into four phases separated by stage gates that must be cleared before the next phase begins. The estimates of how long each phase of work takes are based on the longest chain of dependent activities within that phase.
Organizing the work into four research tracks
The research activities are grouped into four tracks:
- Impacts: Includes modeling climate response, climate impacts, and risks under SAI, and develops the tools needed to make said modeling more efficient and robust.
- Aerosols: Research activities designed to better quantify and understand aerosol behavior including microphysics, chemistry, and stratospheric transport.
- Observations: Activities focused on modeling, designing, building, and maintaining the observational instruments, platforms, and field campaigns needed to measure what happens in the stratosphere and on the Earth’s surface.
- Engineering: Spans the aircraft and delivery systems needed to lift material into the stratosphere, along with the supply chains and materials handling behind them.
Activities in each track answer different questions, draw on different expertise, and will often be funded by different organizations. Grouping them this way makes those differences clear, and lets a funder support a coherent portion of the work. Some activities span two tracks, and we have allowed that rather than forcing artificial boundaries.
A clinical trial approach to reducing uncertainties
The roadmap advances in phases, and as in a clinical trial, movement between them is not automatic. Each phase must measurably reduce uncertainty before the next can be considered.
- Phase 0 builds foundational knowledge
- Phase 1 constrains aerosol microphysics
- Phase 2 measures stratospheric mixing and distribution
- Phase 3 monitors deliberate cooling
Outdoor experiments anchor Phases 1 and 2 and provide critical new data, but they are far from the whole of either phase.
- Aerosol microphysics experiment (Phase 1). An injection of roughly 10 tonnes of SO₂ per flight, used to study the processes controlling aerosol size distribution over days to weeks by tracking and analyzing the microphysics in the plume.
- Aerosol evolution and transport experiment (Phase 2). Much larger injections — roughly 25,000 tonnes in a season, potentially repeated over several years. This would constrain both the aerosol size distribution at steady-state burden and the uncertainty in stratospheric transport, which controls aerosol lifetime and the spatial pattern of the burden.
Progress is assessed at stage gates. At each gate, the full body of evidence — not just the result of an experiment — is weighed against criteria set in advance. Reflective's Uncertainty Database tracks how well understood each open question about SAI is, rating it high, medium, or low, and records how those ratings change over time. To move from Phase 1 to Phase 2, every high priority uncertainty and all medium priority impacts uncertainties must come down to medium or lower priority uncertainty (see image). To move from Phase 2 to Phase 3, every remaining uncertainty — across engineering, aerosols, observations, and impacts — must sit at lower priority uncertainty.
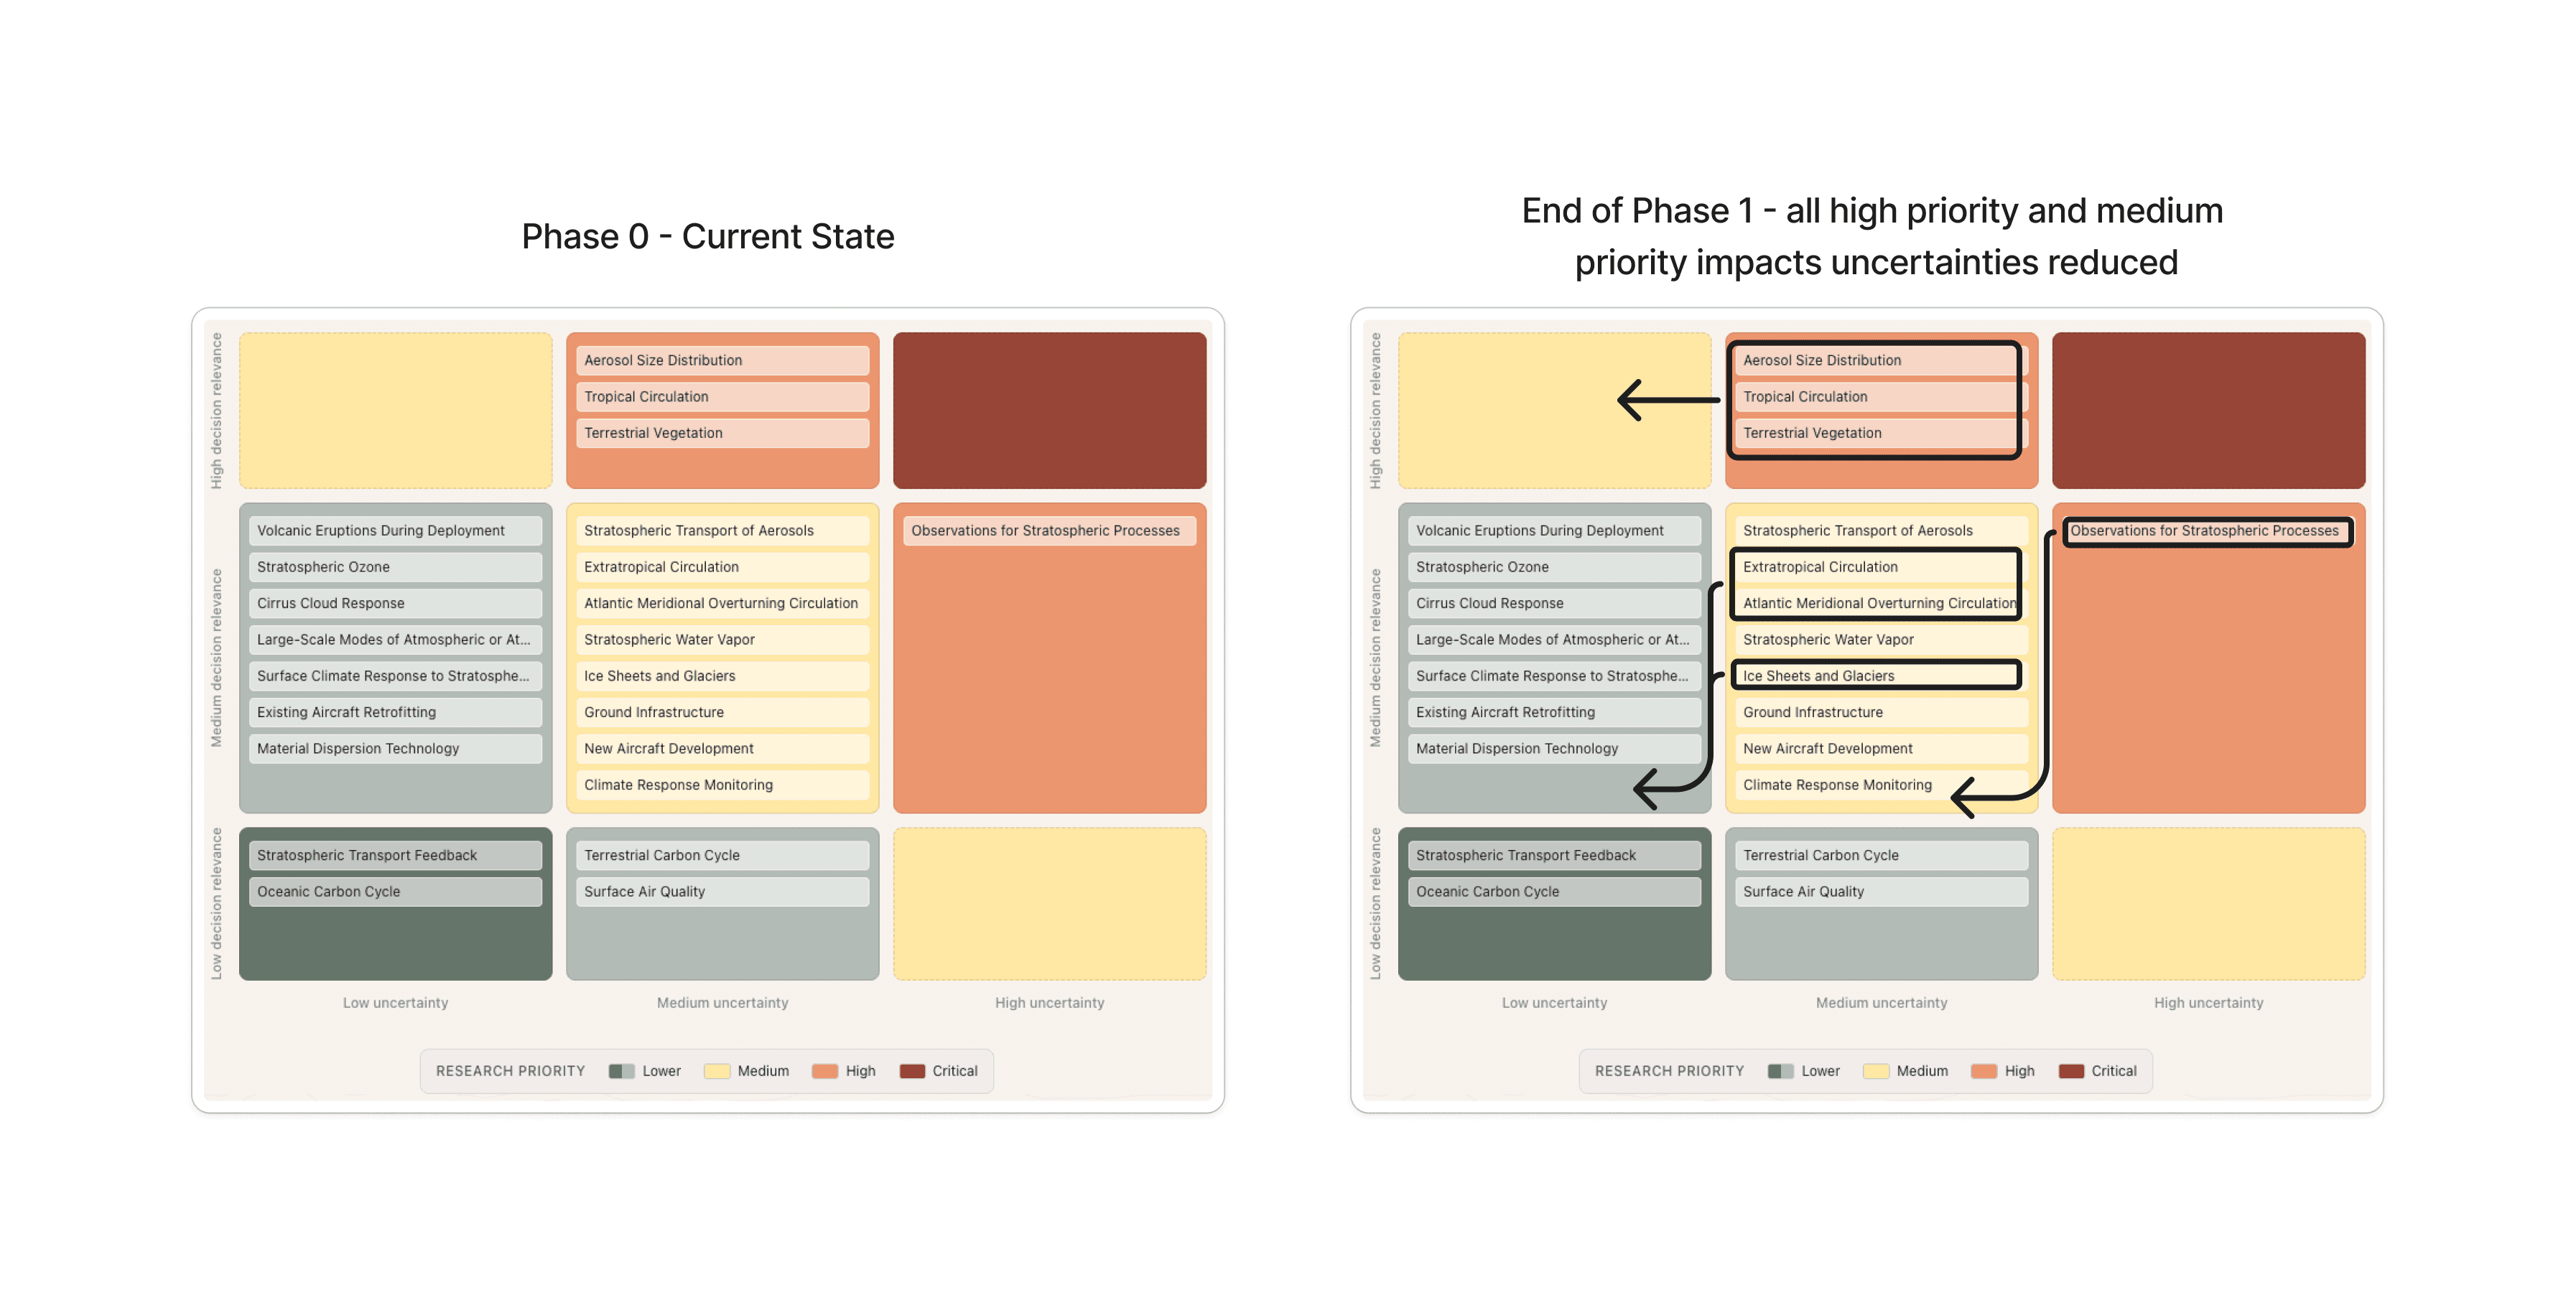
Open questions from Reflective's Uncertainty Database, plotted by uncertainty (horizontal) and decision relevance (vertical), before and after Phase 1. Outlined uncertainties are those that Phase I is designed to reduce.
Funding and coordination determine the overall timeline
The roadmap shows what is possible if research is funded appropriately and globally coordinated. It asks: if everything that could run in parallel did, how long would each phase take? The answer is set by the longest chain of dependent activities that must finish before the phase can end.
In Phase 1, for instance, the longest chain of dependent activities is the aerosol microphysics experiment and the subsequent work to improve aerosol microphysics in climate models. Together they take 4–8 years, which sets Phase 1's timeline, even though other activities run alongside that chain. Further compression may be possible with more compute power, more personnel, and/or more parallel research teams.
Under this scenario, decision-makers could arrive at the last stage gate in the Roadmap in 10-22 years for ~$370M to $1.36B.
Uncertainty reduction estimates
The goal of the Research Roadmap is to reduce uncertainty about SAI, and coming up with a single metric of how much each phase of research reduces uncertainty was a challenge. The Uncertainty Database features nearly two dozen individual uncertainties. Substantial portions of the work in Phases 0 and 1 are aimed at improving mechanistic understanding of impacts—that is, the physical processes that produce them—so that projections of how SAI would affect the systems that matter most for decisions become far more reliable.
Reducing these uncertainties clearly improves the ability to make decisions about SAI. Expressing that improvement as a number, though, would require knowing what a decision demands: who decides, against what thresholds, and what evidence each stage gate requires. Those questions are not yet settled, so any such number would rest on unfounded assumptions.
We chose a more concrete metric: how much the research reduces uncertainty in cooling efficacy: the amount of global mean cooling that SAI would deliver per tonne of sulfur injected. We chose it for four reasons.
- Efficacy is very poorly constrained today. Current models disagree by more than a factor of two.
- It depends on two other important uncertainties: the size of the aerosol particles, and how those particles move through the stratosphere.
- It affects potential risks, including ozone depletion and surface air quality.
- Any decision to deploy SAI would be a decision about a specific quantity of sulfur. Uncertainty in efficacy therefore translates directly into uncertainty about the cooling a given deployment scenario would produce.
Cooling efficacy has one further advantage: we can make a reasonable estimate of how much the central experiments in Phases 1 and 2 would narrow it. Those estimates are described below.
Estimating how experiments will reduce uncertainty in efficacy
Right now, models disagree by about a factor of two on how much cooling a given injection would cause, or the efficacy of injection. The experiments that are the defining features of Phase 1 and Phase 2 will dramatically reduce that uncertainty in efficacy, and we have roughly quantified the reduction from each.
Aerosol microphysics experiment
Based on the spread between models in different aspects of their response to SAI, we estimate that about 40% of the variation in overall efficacy is driven by differences in the average size of aerosol particles. Separately, a perturbed parameter ensemble — a set of runs testing one climate model's sensitivity to changes in how it represents SAI — suggests the aerosol microphysics experiment in Phase 1 could resolve around 60% of that aerosol size uncertainty. Together these imply overall efficacy uncertainty could fall by about a quarter (40% × 60% = 24%).
Aerosol evolution and transport experiment
We assume the aerosol evolution and transport experiment in Phase 2 could resolve uncertainty in aerosol size, stratospheric lifetime, and the large-scale spatial pattern of the aerosol burden. Together these set the overall radiative forcing under SAI and its spatial and seasonal pattern. To estimate the effect of knowing them, we contrast climate model simulations that uniformly reduce insolation with those that inject sulfur dioxide — using the uniform-insolation runs as a proxy for holding all these aerosol factors constant across models (Visioni et al., 2026). Model spread falls by around two thirds (~66%) between these cases, which is our estimated upper bound on efficacy uncertainty reduction.
We anchor our estimate of current uncertainty to the spread in efficacy across climate models contributing to the recent GeoMIP experiment G6-1.5K-SAI, an SAI scenario similar to the one assumed here. Those simulations give a range of 0.07–0.17 °C/Tg/yr¹. Model spread is not the same as true uncertainty, but it gives us a quantitative starting point. It is also part of the motivation for running experiments at all: we will ultimately rely on these models to project the impacts of any deployment, so improving and validating them is itself a goal.