
Here, we estimate how much our present-day uncertainty in the efficacy of sulfate SAI – the global cooling achieved for a given magnitude of injection – could be reduced through successful experimentation (SO₂ releases) at two very different scales:
- Aerosol microphysics experiment: A small-scale experiment involving approximately 10-tonne injections of SO₂ (per flight), used to study the processes which control aerosol size distribution on timescales of weeks to around a month, by tracking and analysing the microphysics in the plume. This experiment would be repeated multiple times. It is not yet certain how many repetitions would be required but we assume here that a sufficient number are performed to resolve uncertainties as described below.
- Aerosol evolution and transport experiment: A large-scale experiment (or injection activity), involving injection of roughly 25,000 tonnes in a season, repeated over multiple years, and used to constrain both the size distribution at steady-state burden (i.e. removing the uncertainty arising from coagulation and other processes dominant after the 1-month mark) and the uncertainty in transport which controls both aerosol lifetime and the spatial pattern of the aerosol burden. To remain detectable over this duration, the amount released must be large enough to stand out against background stratospheric sulfate aerosol concentrations even after dramatic dilution. Current estimates suggest a total injection of 25,000 tonnes of SO₂ in one hemisphere over the course of one season, using daily flights might suffice, but more research is required to refine this estimated injection magnitude.
We note that while we can make some estimate of the model spread that results from processes that would be resolved by these activities, it is important to recognize that the actual uncertainty is likely larger than the model spread would indicate; there may be important processes missing from all of the models and the only way to know for sure is with real-world data.
What is our current uncertainty in efficacy?
As in Reflective’s Uncertainty Database, we use the multi-model range of recent GeoMIP simulations to inform our estimate of uncertainty. The spread across climate models is not a true uncertainty. For some quantities, other lines of evidence support a narrower assessment of uncertainty (for example, the IPCC assessment of uncertainty in equilibrium climate sensitivity, based on multiple lines of evidence, is narrower than the model range; IPCC AR6 WG1 Fig 7.18). In other cases, our true uncertainty is likely larger than the model range, where, for example, models are all missing certain processes (e.g., sub-grid-cell ones, such as small-scale turbulence) which would increase their spread. Similarly all models used here share similar, modal, aerosol schemes, which differ substantially from more computationally expensive ones (Tilmes et al., 2026). Additionally, only a handful of models with interactive aerosols (necessary to derive efficacy) have simulated GeoMIP experiments, so GeoMIP model range is under-sampling the set of around 50 CMIP6 participating models.
Nevertheless, we here use the multi-model spread to characterise current uncertainty for two reasons. First, pragmatically, this is often the only clear route to any form of quantification, and as a first-order estimate it is better than nothing. Second, climate models underpin predictions of SAI’s impacts, and their outputs feed into decision making and any eventual attribution of SAI’s impacts. As such, one of the key motivations for conducting experiments is to improve and validate the models themselves, and their range is a policy-relevant quantity even where it does not align to our true uncertainty.
We define efficacy as global mean near-surface air temperature change (cooling), in °C, divided by annual injection magnitude of SO₂, in teragrams (Tg), with both quantities taken to be decadal means over the same time period, which is decades into a large-scale deployment. The range in efficacy, defined in this way, among the four GeoMIP models recently simulating a scenario broadly in line with our assumed deployment scenario (G6-1.5K-SAI; 30°N/S injection equally in both hemispheres, growing gradually to hold temperature at 1.5 °C above pre-industrial) is [0.10–0.12] °C/Tg yr⁻¹ (Figure 1; and also shown by Lee et al., 2026).
However, as pointed out by Lee et al. (2026), this range is likely unrealistically small as a result of different uncertainties canceling out in these four models. Efficacy can be decomposed into the product of the change in global mean aerosol optical depth per unit injection, hereafter “AOD/injection” multiplied by the temperature change per unit aerosol optical depth, hereafter “ΔT/AOD” (e.g. Zhang et al. 2024). The range across the four models in AOD/injection is large compared to the range in efficacy, at [0.008–0.014] Tg⁻¹. The same is true of the range in ΔT/AOD, at [8.0–12.9] °C. In the four models which have so far performed G6-1.5K-SAI simulations these two uncertainties largely cancel out, as the two models with high AOD/injection also have low ΔT/AOD, and vice versa (Lee et al., 2026).
There is little physical reason to expect AOD/injection and ΔT/AOD to vary inversely. The former is controlled by stratospheric circulation and aerosol microphysics and chemistry, while the latter is set mostly by the model’s sensitivity to forcing. As a result, a more defensible estimate of the uncertainty in efficacy implied by these model runs can be derived by assuming the model spread in AOD/injection and the spread in ΔT/AOD are independent. Making this assumption, we calculate the 16 possible combinations of AOD/injection and ΔT/AOD from the four models, and use the 10th–90th percentiles of this as an estimate of the model spread in efficacy. This range is [0.07–0.17] °C/Tg yr⁻¹, as shown in Figure 1c.
The uncertainty range constructed in this way is more in line with that seen in the previous generation of GeoMIP simulations (which used equatorial, rather than subtropical, injection). The G6sulfur scenario showed a range in efficacy of [0.06–0.12] °C/Tg yr⁻¹ across the 3 G6sulfur models with interactive aerosols (Visioni et al., 2021), similar to the range of [0.06–0.13] °C/Tg yr⁻¹ given by Haywood et al. (2022) in the WMO Scientific Assessment of Ozone Depletion: 2022 report. While only a rough approximation, we take this range, of 0.07 to 0.17 °C per TgSO₂ yr⁻¹, to be our present day uncertainty in efficacy for our deployment scenario.
Reducing the uncertainty in efficacy
We assume that our two hypothetical experiments, carried out successfully in the perfect case, would fully constrain the following quantities:
- Aerosol microphysics experiment: the aerosol size distribution at 1 month
- Aerosol evolution and transport experiment:
- the aerosol size distribution at steady-state;
- the lifetime of aerosols against transport and deposition (and thus the aerosol burden per unit injection), and;
- the spatial distribution of the aerosol burden.
Collectively, the uncertainties assumed to be resolved in the aerosol evolution and transport experiment constrain the overall AOD and its spatial and seasonal pattern, and thus the radiative forcing from SAI.
Aerosol microphysics experiment – effect of partially constraining the steady state size distribution only
We aim to construct a quantification of the Aerosol microphysics experiment’s uncertainty reduction by answering two separate questions:
- What is the effect on uncertainty in efficacy of fully constraining the aerosol size distribution and nothing else?
- To what extent is the uncertainty in steady-state aerosol size distribution reduced if we know it at one month after injection?
What would fully constraining the aerosol size distribution achieve?
Figure 1 shows a decomposition of the inter-model range in G6-1.5K-SAI efficacy, as described above. The final range in Figure 1c shows our constructed estimate of the model spread if AOD per unit injection and cooling per unit AOD are assumed independent, which we take to be our present-day uncertainty in efficacy.
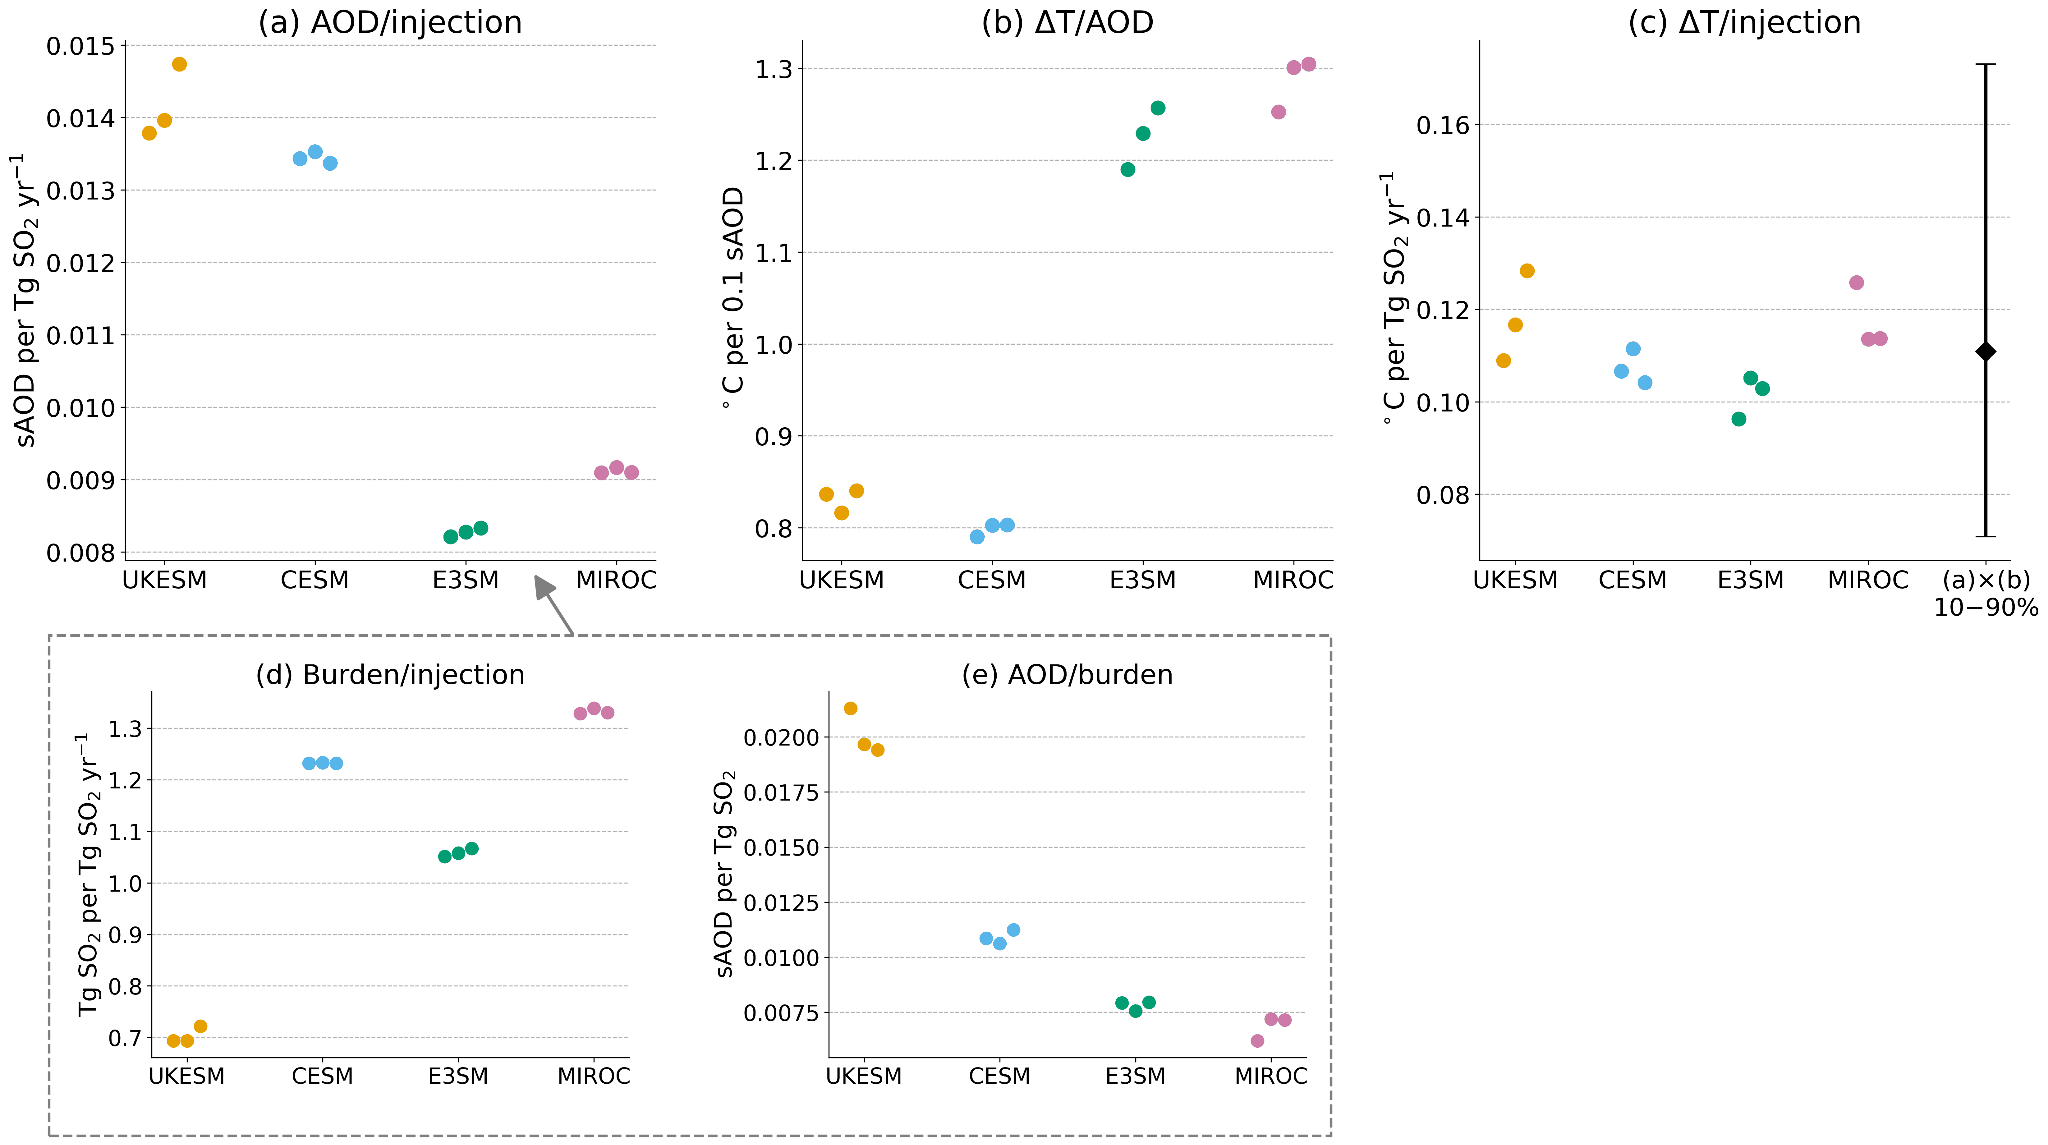
Figure 1: Decomposition of efficacy in the G6-1.5K-SAI simulations, averaged over the final 20 years (2065–2084). Burdens are differences in whole atmosphere sulfate (SO₄) relative to the background SSP2-4.5 scenario, converted to units of SO₂ mass. ΔT is the change in global mean near-surface air temperature relative to SSP2-4.5. (c) includes a range bar indicating our constructed estimate of model spread in efficacy, under the assumption that AOD/injection and ΔT/AOD vary independently.
Given our assumption that the AOD/injection, (a), and cooling/AOD, (b), vary independently (in the hypothetical population sample of possible models), we can assign relative contributions to our estimated range in efficacy, (c). Since efficacy is the product of AOD/injection and ΔT/AOD, we can write For a sum of independent terms, variances are additive, so we can define the contribution of each term to variance in efficacy as its fraction of the sum. Doing so gives relative contributions to the constructed range shown in Fig 1c of 54% and 46% from AOD/injection and ΔT/AOD, respectively.
The AOD/injection term is controlled both by aerosol size distribution and by the background stratospheric circulation, which is a primary driver of the lifetime (burden/injection). The lifetime term is also influenced by the aerosol size distribution, since larger particles sediment faster. However, here we assume that the variance in lifetime is solely driven by variance in circulation between models. This is motivated by the fact that UKESM, which has the smallest aerosol effective radius (Supplementary Figure S1), also has the shortest lifetime (lowest burden/injection), while CESM has a long lifetime (high burden/injection) but also the largest aerosols. Similarly, there appears to be little relationship between lifetime and size in interactive aerosol models simulating the 1991 Pinatubo eruption (Quaglia et al., 2023) As such, the dominant control on the inter-model spread appears to be stratospheric circulation rather than aerosol size. This assumption is an imperfect one – increasing size reduces lifetime, all else being equal – and we would like to revisit it in future. Constraining the impact on lifetime from uncertainty in circulation could be achieved, for example, by driving stratospheric transport models with winds from different earth system models, or using tracer injection substituted for SO₂, injection in earth system models. Reflective intends to perform analysis to revisit this assumption in future.
However, making the assumption for now that variation in Burden/injection is associated with the stratospheric circulation only, and variance in AOD/burden with the aerosol size distribution only, we can repeat our variance of logarithms decomposition as performed above, now to understand the fractional contribution of aerosol size distribution (AOD/burden) to variance in the AOD/injection term. This method gives values of 26% and 74%, for the contributions of variance in Burden/injection and AOD/burden, respectively.
We therefore estimate, with significant caveats due to the several strong assumptions made above, that the variance in aerosol size distribution across models contributes to 74% × 54% = 40% of the variance in efficacy. This may be an underestimate due to the assumption that size does not influence the burden/injection.
To what extent would the aerosol microphysics experiment constrain the aerosol size distribution
To quantify what fraction of uncertainty in steady-state aerosol size distribution for a given injection strategy could be resolved by knowing its value one month after injection (which is our expected upper limit on measurement of aerosol properties in the plume for a ~10-tonne aerosol microphysics experiment), we use a perturbed parameter ensemble (PPE) recently carried out in CESM2-WACCM. This PPE consists of a set of simulations exploring parametric uncertainty in the model’s representation of the 1991 eruption of Mount Pinatubo. Parameterizations in Earth system models are a reduced order representation of more complex physical processes that occur at spatial scales smaller than the resolved model grid (~100 km). The Pinatubo PPE experiment randomly varies 18 key parameters pertaining to the aerosol processes necessary to simulate volcanic eruptions across a 180-member ensemble of otherwise identical simulations. The varied parameters in the PPE cover: injection characteristics, aerosol microphysics, and aerosol modal structure. Here we fix parameters related to uncertainty in the injection itself, giving variation in the 11 parameters related to microphysics and the modal aerosol scheme (MAM; Liu et al., 2016) as shown in Figure 2.
We use this PPE to ask the following question: in this model, what fraction of uncertainty in the aerosol size distribution arises from processes which dominate on short timescales (< 1 month) and what fraction arises from processes occurring on longer timescales (1 month to years). This approach makes several large assumptions. First, we assume processes in the model can be separated into timescales in this way, and second, that contributions to parameter uncertainties in this model, CESM2-WACCM (MAM4), are reflective of our true uncertainties. The values we derive should therefore, as above, be treated only as a first approximation.
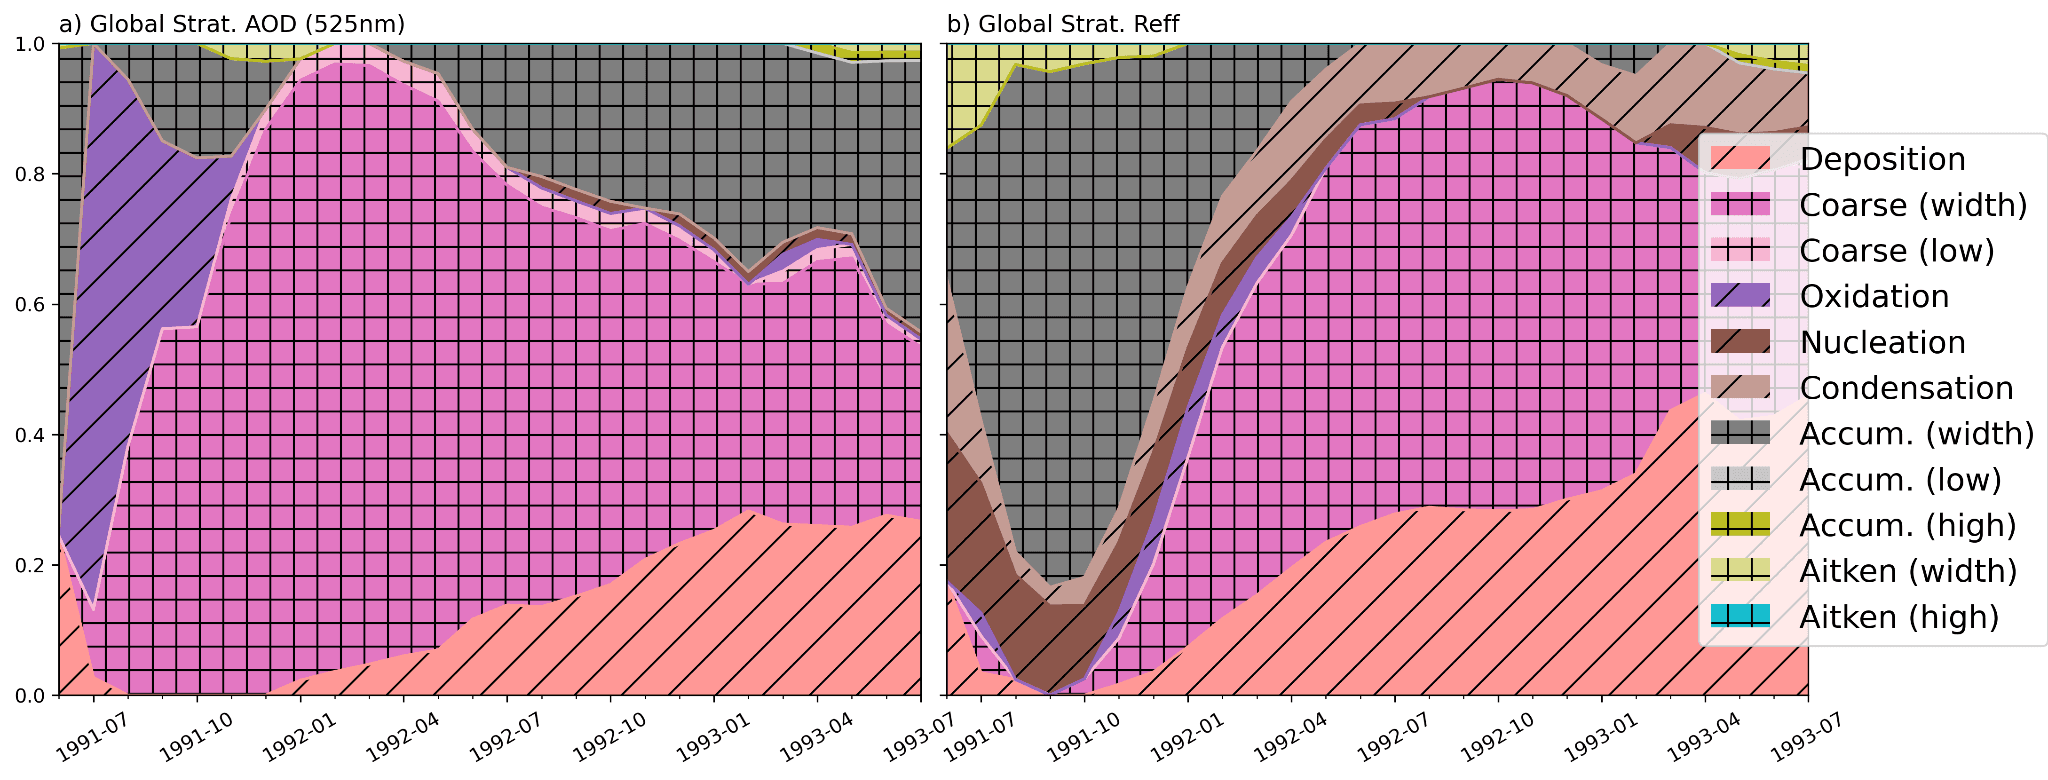
Figure 2: Contribution to variance in (a) global stratospheric AOD at 525 nm, and (b) Global stratospheric sulphate aerosol effective radius, arising from perturbing individual parameters. Slashes denote aerosol microphysical process parameters: aerosol deposition velocity (‘Deposition’); oxidation rate of SO₂ and OH to form sulphate (‘Oxidation’); aerosol nucleation rate (‘Nucleation’); and the condensation of gas phase precursors onto aerosol (‘Condensation’). The grid denotes parameters targeting the modal specifications in MAM: coarse mode width and lower size bound (‘Coarse (width/low)’); accumulation mode width, upper size bound, lower size bound (‘Accum. (width/low/high)’); and Aitken mode width and upper size bound (‘Aitken (width/high)’).
From Figure 2, we can derive an estimate of the proportion of uncertainty in size distribution remaining after processes controlling the distribution at one month are constrained as follows. First, assume that the aerosol microphysics experiment fully constrains the values of all parameters related to oxidation, nucleation, condensation, and the Aitken (width/high) and Accumulation (width/low/high) modes in MAM.
Second, we assume that variation in deposition velocity (Deposition) is most impactful on larger (coarse mode, here defined as particles with radius > 200 nm) particles, so we combine this with the coarse mode parameters (width/dglow) to obtain a single combined contribution from the coarse mode processes. We make a further assumption, that the uncertainty range related to these coarse mode processes can be reduced by 50% by the aerosol microphysics experiment. This assumption is motivated by the fact that modelling of the evolution of aerosols in the plume over days to weeks with relatively slow dilution using the sectional model TOMAS, shows particles in the coarse mode at numbers measurable above the background within 2 weeks, so we assume that the aerosol microphysics experiment would partially constrain this uncertainty. The specific value of 50% is a subjective estimate, made by the Reflective science team, in advance of new research to better quantify this question. However, we note that it is by no means certain that any measurement of coarse mode aerosols could be achieved in the aerosol microphysics experiment; if dilution is faster than assumed in the modeling above, it is possible that the number of coarse mode particles would be insufficient to constrain this uncertainty.
At 1 year (the approximate multi-model mean lifetime of G6-1.5K-SAI simulations; Lee et al., 2026), approximately 20% of variation in global stratospheric AOD (with fixed injection parameters, and not including contributions from circulation) is associated with the sub-coarse mode processes which we assume are fully constrained by the aerosol microphysics experiment, and 80% with the coarse-mode ones which we assume are 50% constrained (Figure 2a). Combining these two elements gives an estimate that 20% + (50% × 80%) = 60% of the uncertainty in size distribution is removed after a successful aerosol microphysics experiment programme. This estimate has substantial uncertainty, particularly as related to whether significant constraint could be achieved using this scale of experiment on processes related to the larger (coarse mode) aerosol particles.
Bringing it together
Combining the estimate that aerosol size distribution accounts for 40% of the model variance in efficacy with the estimate that the aerosol microphysics experiment could reduce our uncertainty in size distribution by 60%, gives an overall estimated reduction in efficacy uncertainty from the aerosol microphysics experiment of around one quarter (40% × 60% = 24%).
Aerosol evolution and transport experiment – effect of fully constraining the aerosol burden’s features
If we knew precisely the size distribution of sulfate aerosols, the amount of them in the stratosphere and their meridional distribution, for a given injection strategy, we would have constrained terms (1) and (2), and partly constrained term (3). However, there would still be a remaining uncertainty in efficacy arising from a fundamental climate uncertainty – its sensitivity to aerosol forcing. This is a closely related quantity to the climate sensitivity to greenhouse gases, a number which itself has a stubbornly large uncertainty range despite decades of research aiming to reduce it. The G6solar experiment provides us with a useful reference point here. It reduces sunlight with the same spatial pattern in all models, and since the perturbation is a direct insolation reduction, it is equivalent to removing the inter-model uncertainty in aerosol lifetime and size which produces the variance in terms (1) and (2) above. The remaining variance between models simulating G6solar can therefore be used as an approximation for the uncertainty remaining if all features of the aerosol burden are known (Visioni et al., 2026).
We take the G6solar range in cooling per unit insolation reduction for the same three models with interactive aerosols (UKESM1, CESM2-WACCM and IPSL-CM6A-LR) which contributed to the G6sulfur range above. This gives a range of [1.04–1.35] °C/%. In order to make this comparable to the G6sulfur case, we convert to units of °C/Tg by scaling the insolation reductions with the ratio of multi-model mean injections (Tg) to insolation reduction (%). This gives a G6solar efficacy range of [0.07–0.09] °C/Tg. In other words, using the limited set of models available, we estimate that constraining the aerosol burden’s size and spatial distributions reduces the efficacy range from [0.06–0.12] °C/Tg down to [0.07–0.09] °C/Tg, that is, from a 0.06 °C/Tg range to a 0.02 °C/Tg range, or by around two thirds. We take this to be a first order estimate of the upper bound on reduction in uncertainty achievable by the evolution and transport experiment. This two thirds reduction is an upper bound, because the model spread in spatial pattern of aerosols under equatorial injection (as in G6sulfur) is large compared to that under 30°N/S injection (as we assume for our default scenario). This means we expect constraining the spatial pattern of aerosols to have a stronger impact when comparing G6sulfur against G6solar. At present, we are constrained to using these simulations despite this drawback, but the proposed GeoMIP G7-1.5K-shade experiment (Visioni et al., 2026), if completed in multiple models, would allow for an update to this method comparing against subtropical injections.
All code to generate the new analyses presented here is available on GitHub and can be reproduced on the Reflective Cloud Hub.
Supplementary Figures
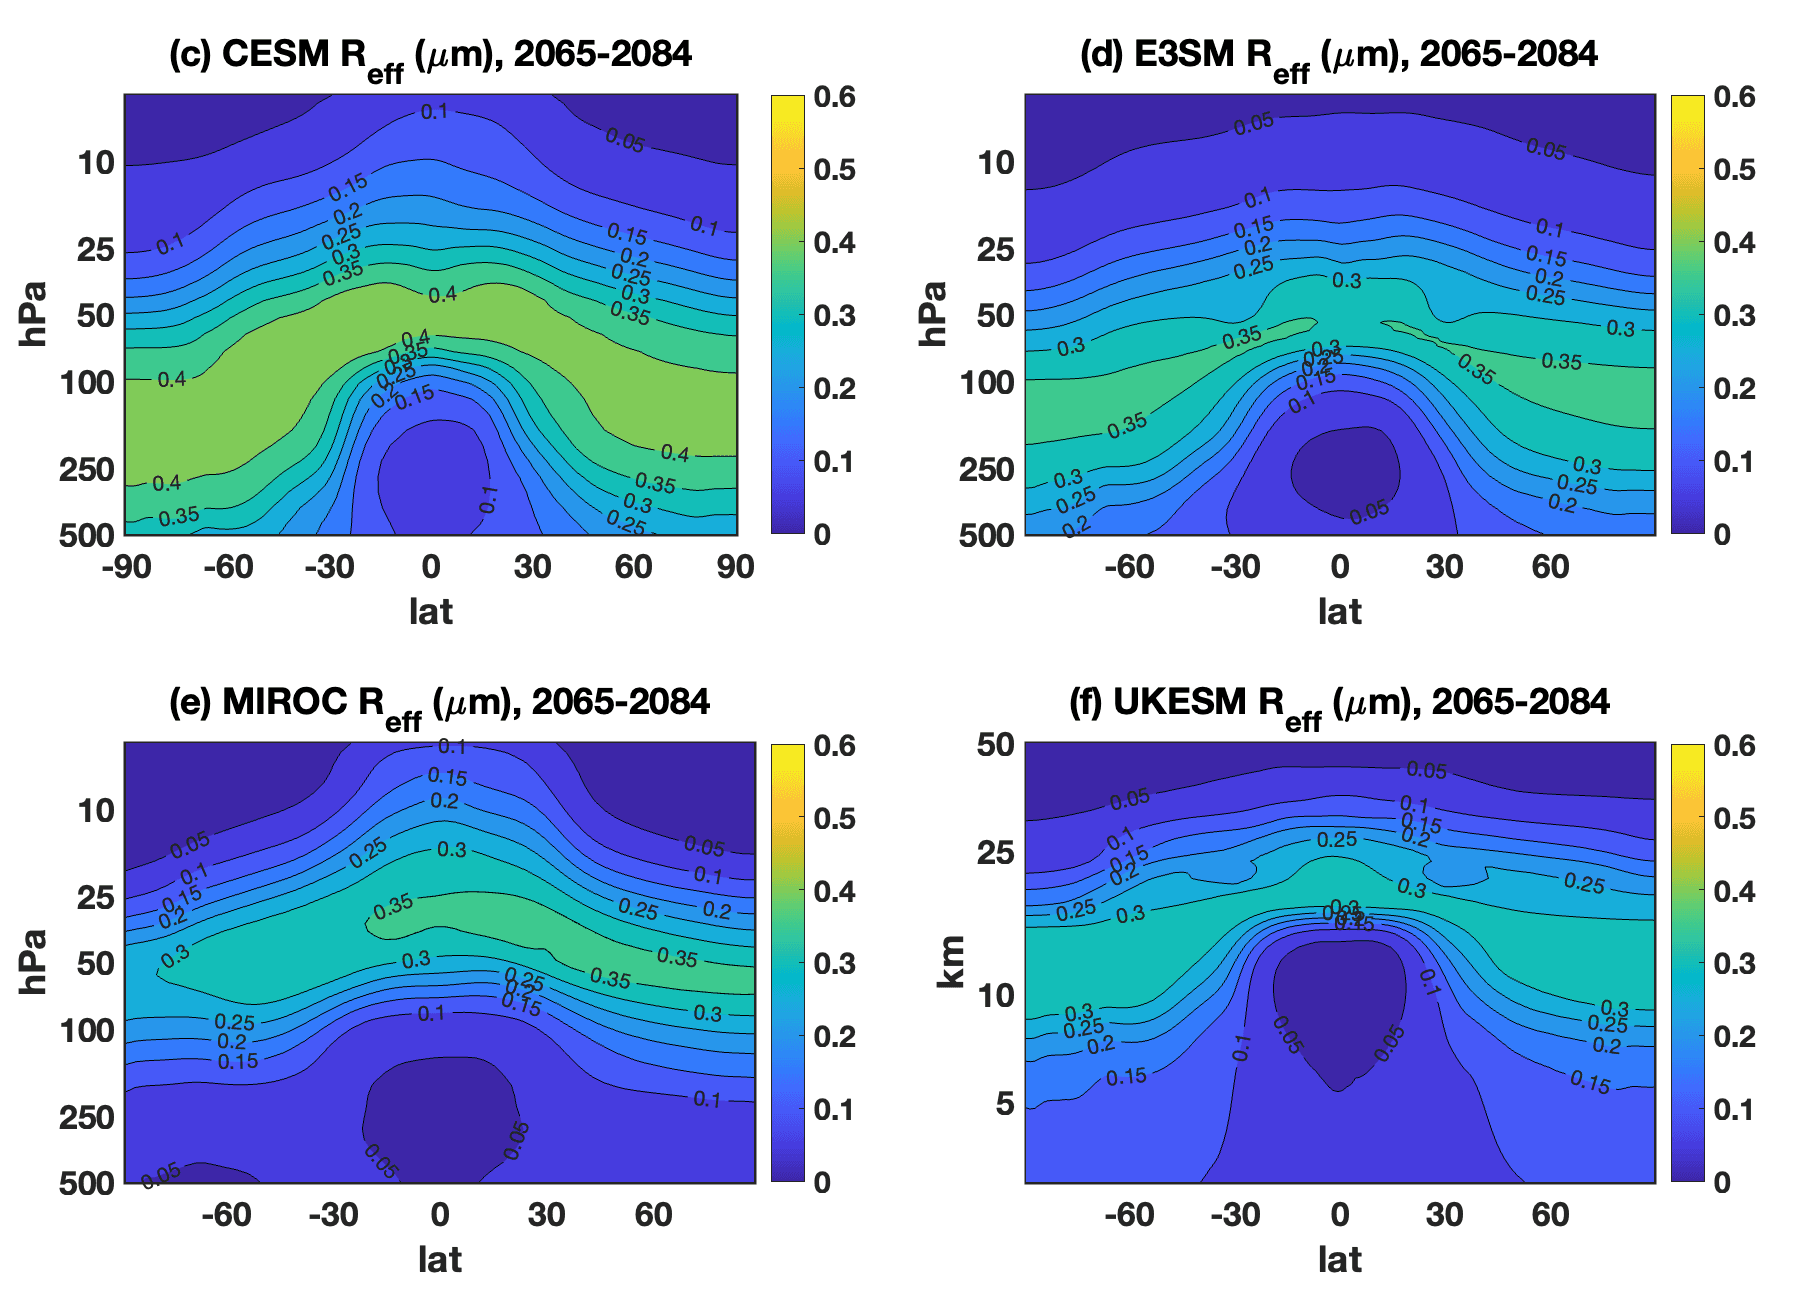
Figure S1: from Lee et al., 2026 (a cropped version of their Figure 4). Zonal mean aerosol effective radius under G6-1.5K-SAI for the four participating models.